

All of us engaged in financial analysis have learned about ratio numbers—profitability, liquidity, solvency—from the very beginning.
However, few truly know how to extract the maximum value from such analyses.
To achieve this, it is essential to compare our ratios with those of competitors and generally accepted benchmarks.
Additionally, performing comparisons
- over time and
- against plans or budgets
is crucial.
Only then do we have enough data to understand the causes of variances that could be detrimental to the company and to develop an action plan.
My goal in this newsletter is to provide some generally accepted benchmarks, keeping in mind industry-specific nuances.
Importance of Benchmarking
Benchmarking involves comparing a company’s financial ratios to industry standards or competitors to identify areas of improvement and ensure the company is performing optimally.
This practice is crucial for understanding the relative performance of a company. By identifying where a company stands relative to benchmarks, financial analysts can pinpoint strengths and weaknesses, informing strategic decisions.
It is important to note that this analysis is not exhaustive and may not be entirely reliable, as these numbers can vary significantly across different industries. The analysis presented here serves as a general benchmark.
Profitability Ratios
Gross Margin
For professional services, a good gross margin is over 60%, with a standard around 50%. Anything below this is concerning.
Gross margin is a critical indicator of how efficiently a company produces its goods or services relative to its revenue.
For instance, a consulting firm with a gross margin of 40% is likely underperforming compared to industry standards, indicating potential inefficiencies in cost management or pricing strategies.
For some wholesalers, a gross margin of 15% would seem very promising.
Net Margin
Net margin varies based on the functions a business provides, the required know-how, technology, and risk levels.
For service-oriented firms that use fewer material resources, a higher net margin is logical.
For example, in the consulting industry, a net margin of 15% might be considered low, while the same margin in the automotive industry could be deemed high.
This illustrates the necessity of understanding industry-specific benchmarks to accurately evaluate financial performance.
Liquidity Ratios
Liquidity ratios, such as the current ratio and quick ratio, measure a company’s ability to meet its short-term obligations.
A current ratio (current assets divided by current liabilities) of 2:1 is often considered healthy, indicating that the company has twice as many assets as liabilities.
However, benchmarks can vary by industry. For example, retail companies typically operate with lower current ratios due to faster inventory turnover compared to manufacturing firms.
Example
A retail company with a current ratio of 1.5 might be performing well compared to the industry average of 1.2.
Conversely, a manufacturing firm with the same current ratio could be underperforming if the industry benchmark is 2.5.
Such differences underscore the importance of industry-specific benchmarking in liquidity analysis.
Solvency Ratios
Solvency ratios assess a company’s long-term viability and its ability to meet long-term obligations.
The debt-to-equity ratio is a common measure, with a ratio below 1 generally indicating a healthier balance.
However, the acceptable range can vary significantly across industries. For instance, utility companies, which often have stable cash flows, can sustain higher debt levels compared to tech startups.
Example
A utility company with a debt-to-equity ratio of 1.5 might be in line with industry standards, while the same ratio for a tech startup could signal excessive leverage and financial risk.
Benchmarking Over Time and Against Plans
Comparing financial ratios over time helps identify trends and potential issues before they become critical.
Additionally, benchmarking against budgeted figures provides insights into performance relative to expectations, aiding in effective management and strategic planning.
Example
A company’s net profit margin might have been 12% last year and dropped to 10% this year.
While this decline might initially seem minor, benchmarking against industry standards and historical performance could reveal underlying issues such as rising costs or declining revenue.
By identifying these trends early, companies can take corrective actions to improve profitability.
I have an excel with financial statements and ratio calculations. You can download it here

Industry-Specific Benchmarks
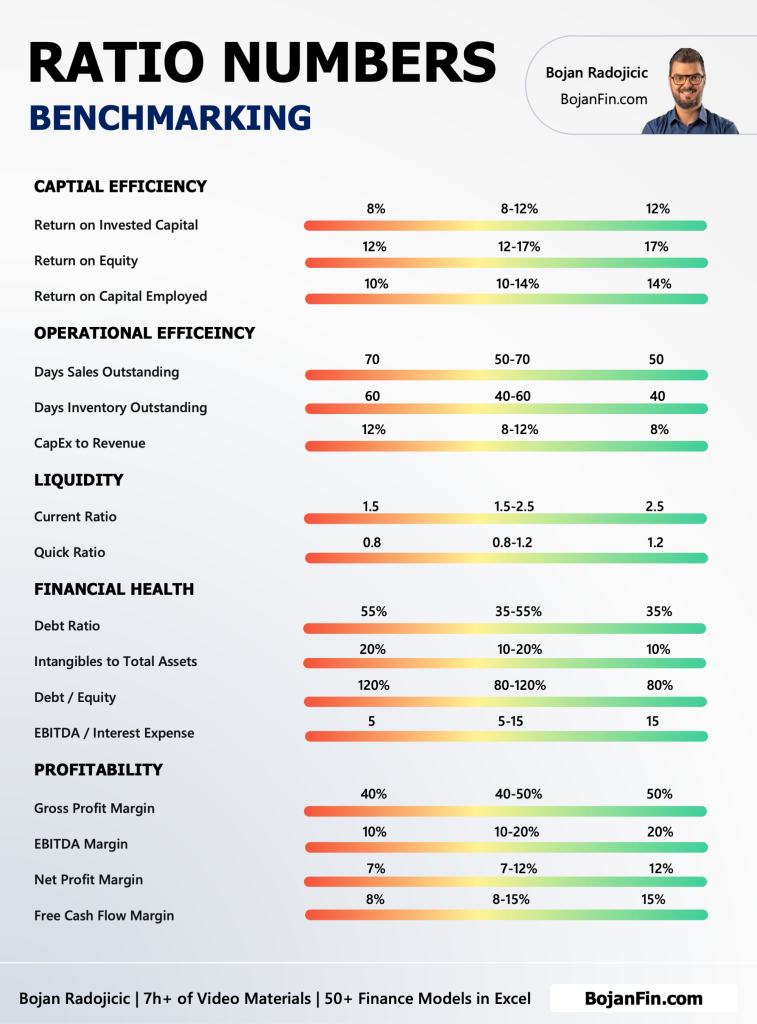
It’s crucial to consider industry-specific benchmarks for a more accurate analysis. Here are some examples:
- Professional Services: Gross margin > 60%, Net margin > 15%
- Automotive Industry: Gross margin around 20%, Net margin around 5%
- Retail: Current ratio 1.2-1.5, Quick ratio 0.5-1.0
- Technology: Debt-to-equity ratio < 1, High net margins due to low material costs
By understanding and applying these industry-specific benchmarks, companies can gain a clearer picture of their financial health and competitive standing.
Conclusion
In conclusion, effective financial analysis goes beyond calculating ratios; it involves benchmarking against industry standards and competitors, performing temporal comparisons, and evaluating against plans or budgets.
By doing so, financial analysts can uncover variances, identify potential risks, and develop actionable plans to enhance company performance.
Embracing benchmarking as a strategic tool enables companies to stay competitive, optimize operations, and achieve sustainable growth.
Keep in mind, industry-specific benchmarks are critical for an accurate assessment.
For professional services, high gross and net margins are expected, whereas manufacturing and retail might operate with lower margins but have different liquidity and solvency benchmarks.