

2 Excel templates:
1) Net working capital planning
There are several formulas to calculate working capital. That depends on the specific analysis we aim to conduct.
A. The difference between Current Assets and Current Liabilities.
B. The difference between Current Assets (excluding cash) and Current Liabilities (excluding financial debt).
C. Account receivables + Inventories – Account payables
The first formula is primarily used when assessing a company’s liquidity.
However, in financial planning, working capital is typically utilized to project cash flows, and the term used for this is usually net (operating) working capital.
In such cases, we often employ the second or third formula that excludes cash and financial debt, as these categories are planned independently.
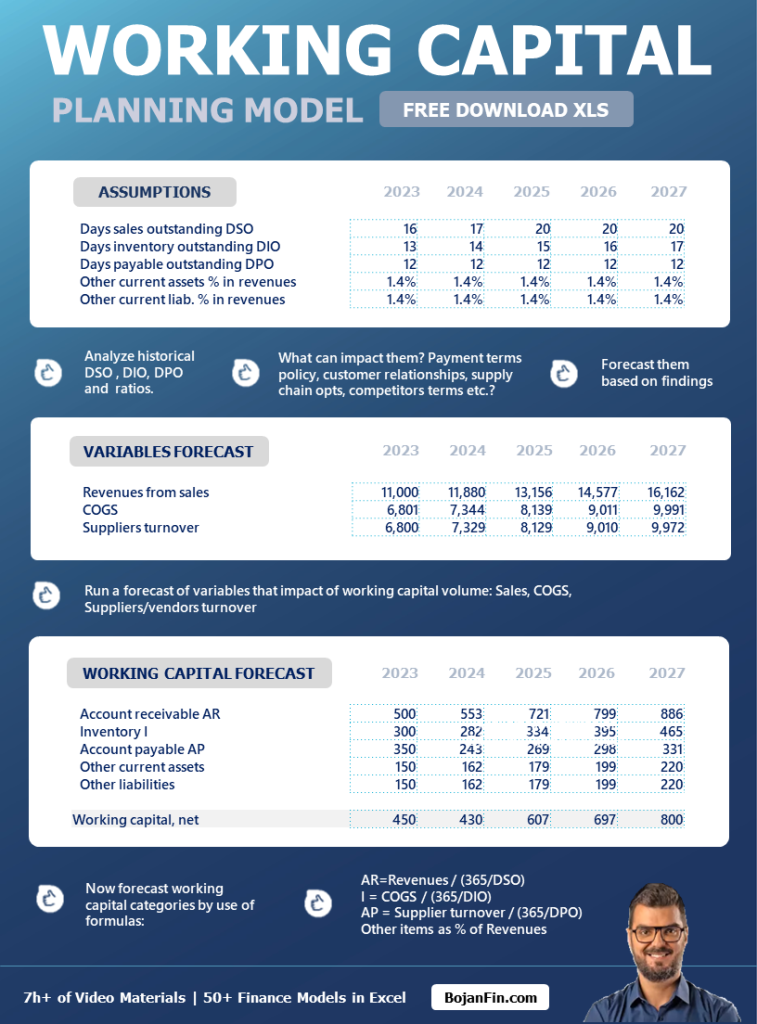
So when it comes to the working capital projection we need to forecast each category, including
- inventories
- accounts payable
- other current assets
- accounts receivable
- other current liabilities
Click here to get your Excel template

The model can be adjusted very easily to any company. Later in this issue, I have visual support for this model as well.
2) Customer acquisition model
The finance and sales sectors are always in some sort of “cold war” or competition.
The sales team often sees us in finance as merely a service function and doesn’t understand how we add value to business transactions.
Therefore, it’s important to have strong skills in analyzing customer sales and channels so that we can always demonstrate our expertise to our colleagues.
That’s why I created this model, which shows how we acquire customers, what the conversion rates are, and identifies areas for improvement.

Click here to get your Excel template
This model, with small adjustments, can be used for many industries.
Here are 2 Infographics for Today:
1) Working capital model
Get this infographic on a high-resolution PDF
2) ROIC vs WAAC

Get this infographic on a high-resolution PDF
Here’s today’s “How to” guide:
How to forecast an income statement in 12 steps.
STEPS:
1) Define Layout
Define your Functional Income Statement (IS) layout with lines. The lines in the IS should reflect the business functions, revenue, and cost drivers in the best possible way.
2) Calculate Key Metrics
Add formulas for aggregate categories like gross profit, EBIT, and net income.
3) Use Supporting Sheets (Schedules)
Open supporting sheets for each important line. For example, have a separate sheet for revenue planning. Import historical data, create trend analysis, identify drivers, and make assumptions for forecasting. The idea behind the supporting sheet is that as much data as possible should be linked to the main IS sheet.
4) Revenue Forecast is Key
Make revenue forecasts for each type of revenue or per customer based on assumptions such as expected growth rate, customer retention rate, pipeline customers, etc.
5) Gross Profit Planning
Based on gross margin per type of revenue/product/service line, estimate gross profit and COGS. This is a simplified approach. You can analyze gross margin for each product and, based on sales quantities and average price, estimate gross profit for each product.
6) Do Salaries Planning
List all employees, their current wages, bonuses, etc. Then estimate salary increases for current employees. Add new hires and estimate their costs in the projected period.
7) Depreciation Forecast
Create two depreciation schedules, one for current assets and one for new assets, and calculate costs based on (remaining) useful life.
8) Use Loan Schedules for Interest Projection
For existing loans, take expenses from the loan schedule. For new loans, create your schedule and forecast interest.
9) Fixed Costs
Fixed costs are typically analyzed using trend analysis. Therefore, I suggest creating an analysis of the movement of these costs over historical periods and calculating a historical growth rate. You can use this rate for projecting fixed expenses.
10) Variable Costs
All variable costs are projected as a percentage of a dependent variable. For example, sales costs can be projected as a percentage of revenue. Warehouse costs can be projected as a percentage of the cost of goods sold.
11) Transfer Data from Schedules into IS
Transfer forecasted revenues from the revenue sheet to the IS. Transfer forecasted expenses from related sheets to the IS.
12) Forecast Income Tax
Apply the corporate tax rate to income before tax. However, this is not straightforward. You need to analyze trends in the effective tax rate and be aware of potential tax base adjustments. Additionally, you need to be familiar with any changes in tax legislation that may affect future income taxes.
If you have any challenges in forecasting, let me know!
P.S. If your company needs support in finance, my team of 20 top-tier consultants is ready. This is what we do:
- Building powerful management reports, forecasts, budgets, models
- Business valuations, support in M&A transactions, due diligence and more
- Developing transfer pricing policies and local or master files
P.P.S. If you want to grow your career in finance you can take one of my courses and tutorials. I want everyone to have access to my courses, so I offer discounts for countries with lower purchasing power. Click on the course below to get the price for your country.

