

Many FP&A tools promise better dashboards. Few attempt to rebuild the financial planning workflow itself.
Recently I spent time examining a platform called Switch-IO, which approaches FP&A from a fundamentally different angle. Instead of layering analytics on top of existing data exports, the system attempts to connect ARR behaviour, churn prediction, operational KPIs, budget management, and cash forecasting into a single continuous planning infrastructure. Each layer feeds the next. A change in ARR intelligence propagates into revenue projections, which update the budget model, which adjusts the cash outlook.
That architectural ambition is easy to describe and hard to execute. This article describes what I found.
Starting With ARR – And Not Stopping There
Switch-IO treats ARR not as a reporting metric but as the primary input to everything downstream. This sounds obvious until you consider how most finance teams actually manage ARR- as a spreadsheet updated monthly from a CRM export, decomposed into a bridge for board meetings and then archived until next quarter.
The platform maintains a persistent, customer-level ARR record continuously updated from connected CRM and billing sources. Every customer has an ARR profile: acquisition date, source, region, industry, contract value, renewal timeline, gross and net retention, and the full revenue evolution since onboarding. The ARR bridge – new, expansion, contraction, churn – is not a quarterly calculation. It is a live decomposition reflecting the current state of the book of business at all times.
Why does this matter architecturally? A finance team working from monthly snapshots is building its entire planning model on inputs that may be six weeks stale. Switch-IO’s continuous ARR layer eliminates that staleness and, more importantly, creates the granular customer data required for the prediction models downstream.
Cohort Analytics: Turning History Into Prediction
The cohort analytics view illustrates what continuous ARR tracking enables. The planning interface tracks multi customer cohorts from their acquisition quarter through full ARR evolution.
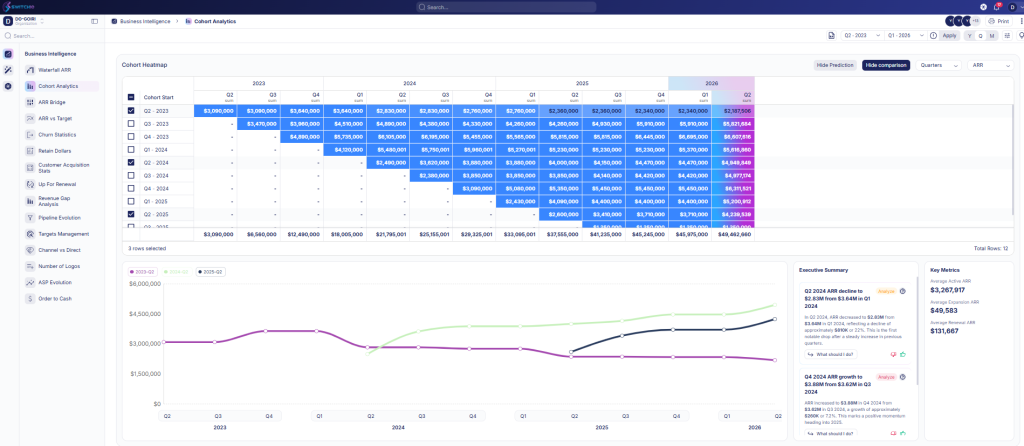
Platform interface: Cohort ARR Analytics – acquisition cohorts tracked through ARR evolution, with AI-generated executive summary and key retention metrics
What is structurally significant is the AI-generated executive summary panel. The system automatically identified that a Q2 2023 cohort experienced a 22% ARR decline from Q1 2024 to Q2 2024 – a reduction of $810K – flagged it and surfaced a prompt for deeper investigation alongside a note that ARR stabilized at $2,830K in Q3. A prediction of the next two quarters is automatically calculated.
The cohort data is not decorative. It is the training dataset for the churn prediction models. Every quarter adds new labelled observations: which customers, in which cohorts, with which behavioural profiles, renewed or churned. The more history the system accumulates, the more accurate its forward predictions become.
Observation → Switch-IO treats cohort history as a live model-training input, not a static reporting output. The distinction changes what becomes possible downstream.
The Churn Prediction Layer – Where the Platform Gets Interesting
Churn prediction is a well-understood problem and a poorly solved one. Most approaches fail by applying threshold rules to individual risk signals: low engagement, pricing sensitivity, support escalations. The limitation is that churn drivers interact. A customer with low engagement but strong executive sponsorship behaves differently than one with identical metrics but a new procurement contact. Rule-based models cannot capture these interaction effects.
Switch-IO trains its prediction model on cumulative cohort history: a growing dataset of renewals and churns, each annotated with multi-variable behavioural signatures that preceded the outcome. The model learns combination patterns – which clusters of signals, weighted by contract size, tenure, segment, and pricing position, are actually predictive of churn. The individual signals are inputs. The prediction is an output of their interaction.
Customer-Level Intelligence in the Planning Interface
The planning interface below shows this in practice. A customer card for 3M Co. is open – $85,000 in active ARR, North America, Energy and Utilities, a relationship since February 2023 with a renewal due February 2026. The platform’s AI assistant has been queried: ‘What is the churn risk for 3M Co.?’
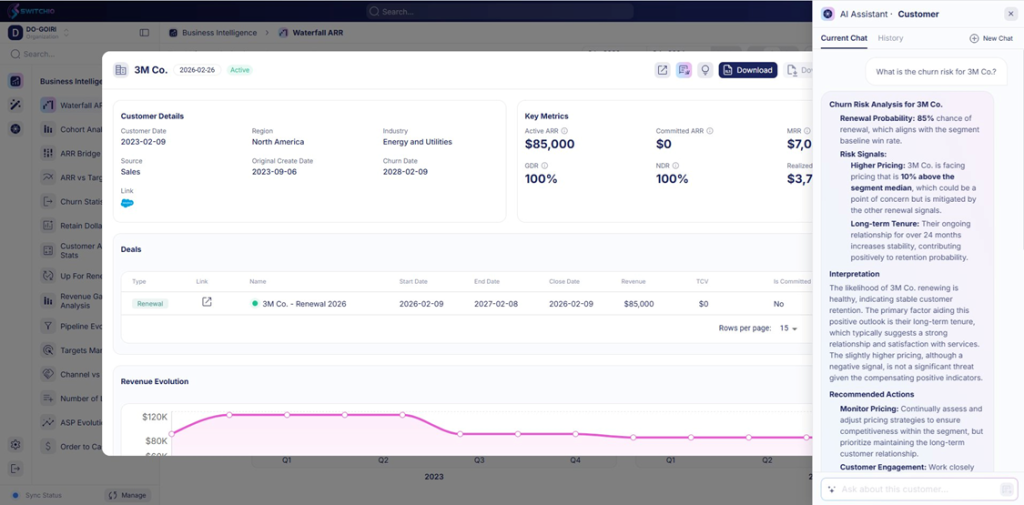
Platform interface: AI Assistant on Customer Card – churn risk analysis with renewal probability, named risk signals, interpretive summary, and recommended actions for 3M Co.
The AI response is not a dashboard widget showing a risk score. It is a structured analytical output: an 85% renewal probability calibrated against the segment baseline win rate; two named risk signals – pricing 10% above the segment median, mitigated by long-term tenure exceeding 24 months; a synthesized interpretation weighing those signals; and specific recommended actions with stated rationale.
Most FP&A and CRM tools surface a score and a color. Red, yellow, green. Switch-IO surfaces an argument – a structured chain of reasoning explaining why the probability is what it is, which signals are driving it in which direction, and what a finance or customer success professional should do about it. That is a meaningfully different design philosophy. It treats the AI as an interpretation layer rather than a reporting layer.
If this renewal probability is calibrated accurately – and calibration improves as the model accumulates more labelled outcome data – then aggregating these predictions across a full renewal book produces an ARR forecast that is bottom-up, evidence-based, and continuously updated. The forecast accuracy difference compounds materially over a full fiscal year.
Observation → The AI functions as an interpretation engine, not a reporting layer. It produces structured reasoning, not scores. This is architecturally significant for planning reliability.
Cash Visibility – The Gap Most FP&A Tools Leave Open
Revenue is not cash. Finance teams know this. Planning tools often ignore it.
The gap between a revenue forecast and a cash position is driven by mechanics that are genuinely complex to model continuously: billing cycle timing, collections behaviour by contract type, deferred revenue recognition, payroll cadences, and vendor payment schedules.
Most FP&A platforms leave the translation from revenue to cash as a manual month-end exercise, with assumptions that are already partially stale by the time the calculation is complete.
Switch-IO embeds the cash model inside the planning infrastructure and connects it directly to the ARR layer above it. As customer-level renewal probabilities update, the customer collections forecast updates. As headcount plans change, personnel expenditure adjusts. The platform maintains a continuous cash outlook rather than a periodic calculation.
Inside the Cash Flow Breakdown
The planning interface below shows the Cash Flow Breakdown for February 2025. Opening Balance: $5,333,433. Closing Balance: $5,179,794.
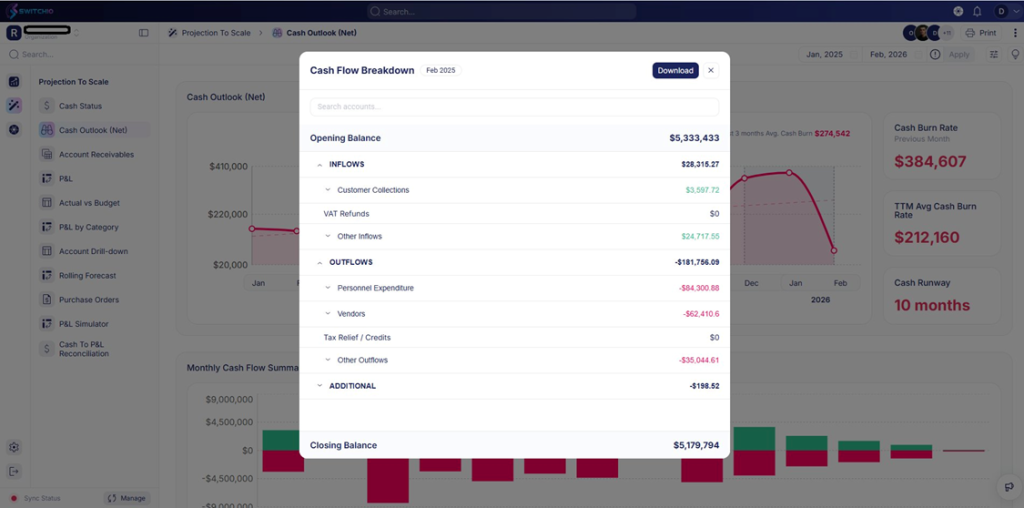
Platform interface: Cash Outlook (Net) – period cash flow breakdown with inflow/outflow decomposition, burn rate metrics, and 10-month runway calculation
The value is in the decomposition. Inflows of $28,315 break into Customer Collections ($3,597.72) and Other Inflows ($24,717.55). Outflows of -$181,756 decompose into Personnel Expenditure (-$84,300.88), Vendors (-$62,410.60), and Other Outflows (-$35,044.61). Three burn metrics are surfaced simultaneously: 3-month average burn of $274,542, previous month burn of $384,607, and TTM average of $212,160. The spread between the TTM average and the previous month figure is itself a signal – burn is accelerating, and it is visible without any manual calculation.
Cash Runway is displayed at 10 months, updated continuously. The fact that it reflects current ARR assumptions rather than last month’s close data changes how a CFO can use it in board conversations and capital allocation decisions.
Observation → Cash inflows are connected to customer-level ARR predictions. When renewal probabilities shift, collections forecasts adjust automatically. The runway number reflects current business reality.
Budget Infrastructure – Continuous Rather Than Annual
The annual budget cycle is a structural impediment to good financial management in fast-moving SaaS businesses. Assumptions reasonable in October are often materially wrong by February. The budget becomes a historical artifact that finance teams spend more time explaining than using.
Switch-IO addresses this through a continuous budget model – a live comparison of actuals against plan that updates as transactions are recorded rather than assembled at month-end close. The budget is not a document. It is a control layer connected to the same data sources as the ARR model and cash outlook.
What the Budget vs. Actual Interface Reveals
The planning interface below shows the Actual vs. Budget view. Actual revenue of $60.86M runs against a $66.81M budget – 91% attainment. COGS actuals yield a Gross Profit at 72% margin against a 68% budgeted margin. Total expenses land at 95% of budget. EBITDA actuals of $1.17M versus a budgeted $666K.
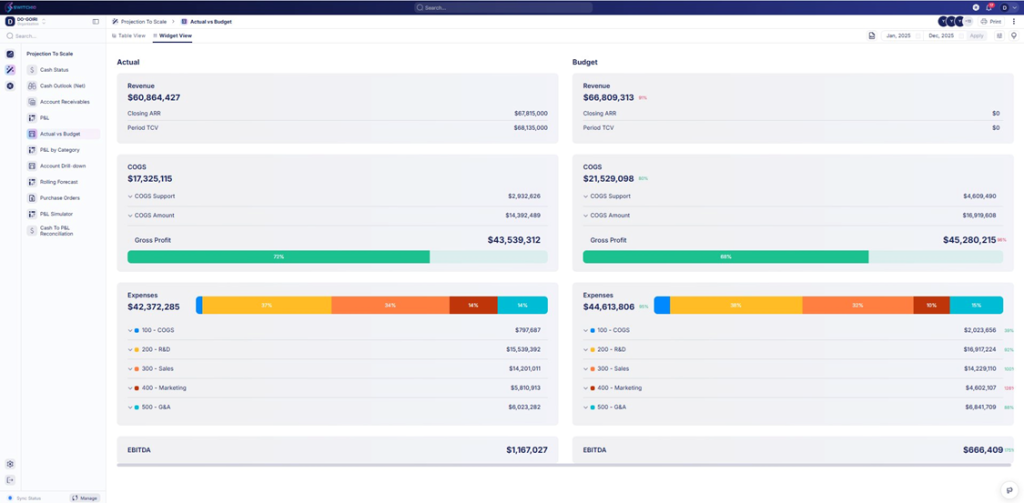
Platform interface: Actual vs. Budget – side-by-side comparison across revenue, COGS, gross margin, department expenses, and EBITDA with live variance percentages
The interface places actuals and budget side by side, with variance percentages attached to every budget line as inline annotations – not a separate column. COGS at 80% of budget. R&D at 92%. Sales at 100%. G&A at 88%. These are live attainment rates that update continuously. A CFO reviewing this in week three of a period is looking at current-state data, not retrospective data.
The department-level breakdown enables a type of conversation that aggregate reporting cannot support. R&D tracking at 92% of budget while Sales is at 100% does not mean the same thing. R&D underspend often signals a hiring delay. Sales at exactly 100% may indicate quota attainment on plan. The department decomposition is where management decisions actually get made.
The gross margin delta is the structural point. The company is running 72% actual gross margin against a 68% budget. That 400-basis point difference, combined with the expense underspend, explains why EBITDA overperformed at $1.17M against a $666K budget despite the revenue shortfall. The interface makes this synthesis visible without manual analysis.
Observation → Budgets function as living control layers, not annual documents. The interface enables diagnosis rather than description – explaining variances rather than just surfacing them.
Why This Architecture Is Difficult to Replicate
After examining these capabilities, the more interesting question is why a well-funded competitor could not simply build the same features. The answer is that the features are not the moat. There are four structural properties that make this architecture genuinely difficult to replicate – not because of timing, but because of what the system fundamentally becomes once it is operational.
Logic That Cannot Be Extracted. Switch-IO’s integrations across ERP, CRM, and HRIS do not transfer data – they encode how a specific organization operates. The mapping between CRM pipeline stages and ARR bridge categories reflects decisions the finance team made about what counts as expansion versus new ARR and where edge cases land. That logic lives inside the running system and nowhere else.
A competitor cannot acquire it through an API, a data export, or an implementation project. It can only be reconstructed by re-mapping every data relationship and re-validating every rule from scratch. No engineering budget changes that.
A Training Dataset No One Else Has. Switch-IO’s churn prediction model is trained on data structurally unavailable to any outside party: the full behavioural history of a specific customer base, annotated with renewal outcomes, linked to ARR bridge movements, segmented by cohort and contract type.
The 85% renewal probability for 3M Co. is not a generic model applied to public signals – it is a model trained on how customers like 3M Co. have actually behaved inside this book of business. A competitor starts from zero labelled data. Their predictions will be statistically inferior not because their engineers are worse, but because the training data does not exist anywhere, they can reach.
Autonomous Mapping and Continuous Alignment. Switch-IO is designed for rapid onboarding through agent-based mapping that automatically interprets structures across CRM, ERP, and HRIS systems. Instead of relying on fixed configurations, the platform maintains a dynamic graph of customers, contracts, transactions, and organizational entities.
When objects, fields, or relationships change in connected systems, these changes are reflected automatically. The financial model therefore remains continuously aligned with operational reality without requiring repeated manual remapping or disruptive implementation cycles.
The Integration Stack Is the Product. Individual modules are buildable, but Switch-IO’s value is not located in any module. It is located in the live connections between them – a shift in a customer’s renewal probability propagates into the collections forecast, adjusts the cash runway, and surfaces as a budget variance without human intervention.
A competitor that solves churn prediction still has to solve ARR bridging, cash modelling, budget variance, and the connections between all four before they have a comparable product. That is not a feature roadmap problem. It is a coordination problem of significant architectural depth.
What This Suggests About Where FP&A Is Heading
Switch-IO may represent an early example of a broader shift in FP&A architecture. The traditional model – static annual budgets, monthly close packages, point-in-time cash forecasts assembled manually – was designed for an era when data was expensive to collect and boards reviewed financials quarterly. That operating environment no longer describes most SaaS finance functions.
What I observed is a platform built on a different set of assumptions: that ARR data should be continuous and customer-level; that churn prediction should be a model trained on behavioural history rather than a threshold rule applied to static signals; that cash visibility should be connected to revenue predictions; and that budgets should function as living control layers rather than annual reference documents.
Whether those assumptions prove correct depends on execution quality and whether finance teams are willing to change the workflows that depend on them. But the architectural direction – toward continuous prediction, customer-level intelligence, and integrated planning infrastructure – is becoming increasingly clear. Platforms built around static models will face growing pressure to explain what they offer that a continuously-learning infrastructure cannot match.
Time will determine how widely this approach is adopted. But the direction – toward continuous, customer-level, integrated financial intelligence – is becoming harder to argue against.
Thank you for reading!
Bojan