

2 Excel templates:
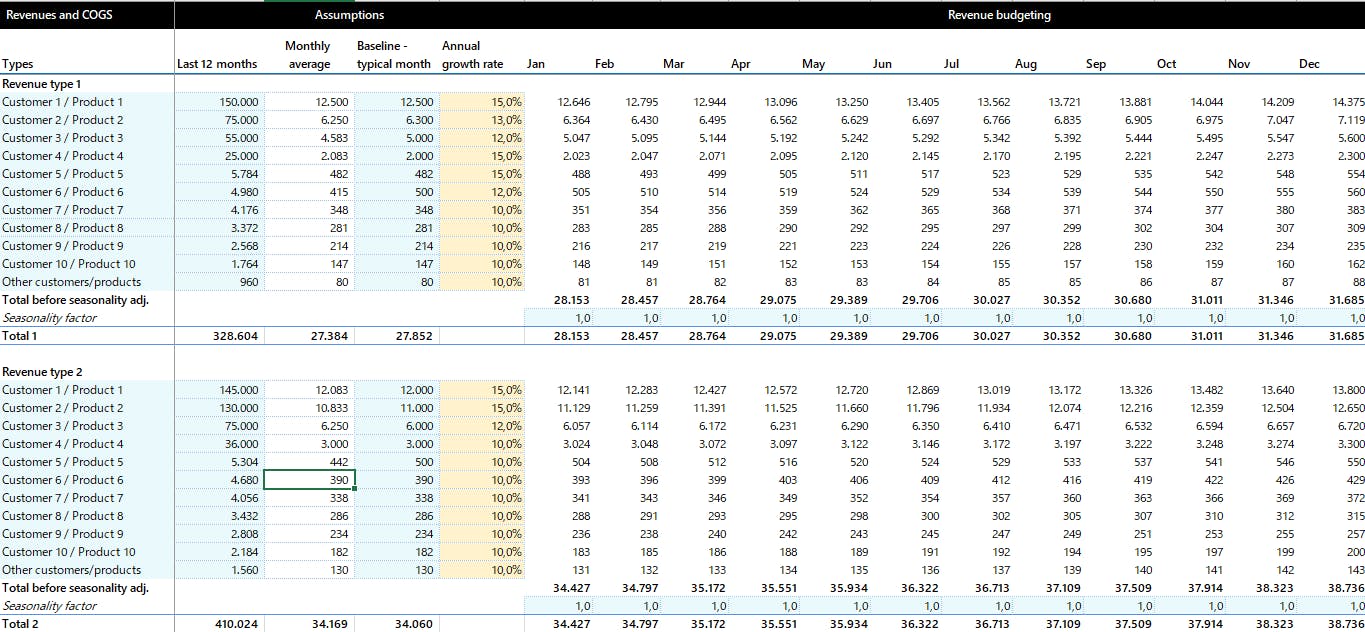
1) Revenue budget template
Budgeting season is knocking on the door.
When it comes to revenue planning, it’s necessary to identify revenue types or segments where we can most reliably estimate the revenue amount for the budget.
Revenue planning can be done at the level of individual customers, sales managers, locations, stores, and others.
In this example, we are providing a budget based on customers, but this template can be adapted for any type of budget.
Additionally, the template includes columns for estimating the basis for the budget, such as historical monthly averages, the last month, and so on.
In the next issue of my Newsletter I will provide an operating expenses budget template.
Click here to get your Excel template.
The model can be adjusted very easily to any company.
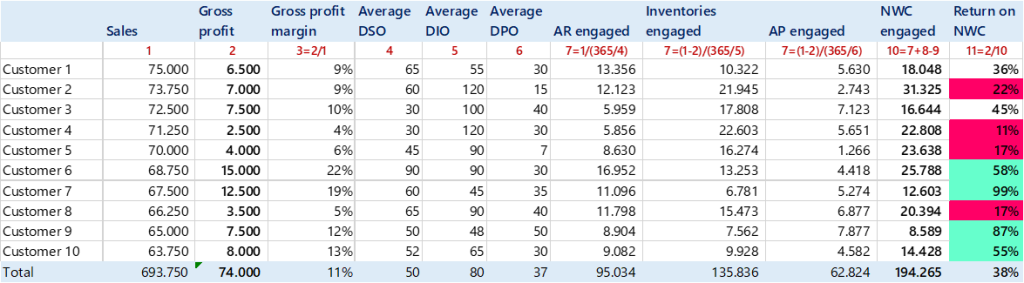
2) Value creation per segment analysis
Let’s assume the company achieves a gross profit of 200k, with net working capital of 1000k, resulting in a gross margin on employed working capital of 20%.
Further, let’s assume that this indicator is very good at the company level. However, upon examining the details, it was found that for some customers, this margin is very low, while for others, it is very high.
For these low performers, it happens that they do not create value at all, or the value is very small.
Therefore, it is important to identify, at the segment level, how the gross margin compares to the employed net working capital.
This can be done at the level of customers, suppliers, or products. Here is a template for assessing value creation at the customer level.
Click here to get your Excel template.
2 Infographics for Today:
1) Real estate company finance model flow

Get this infographic in a high-resolution PDF.
2) Best 50 KPIs for 10 selected industries
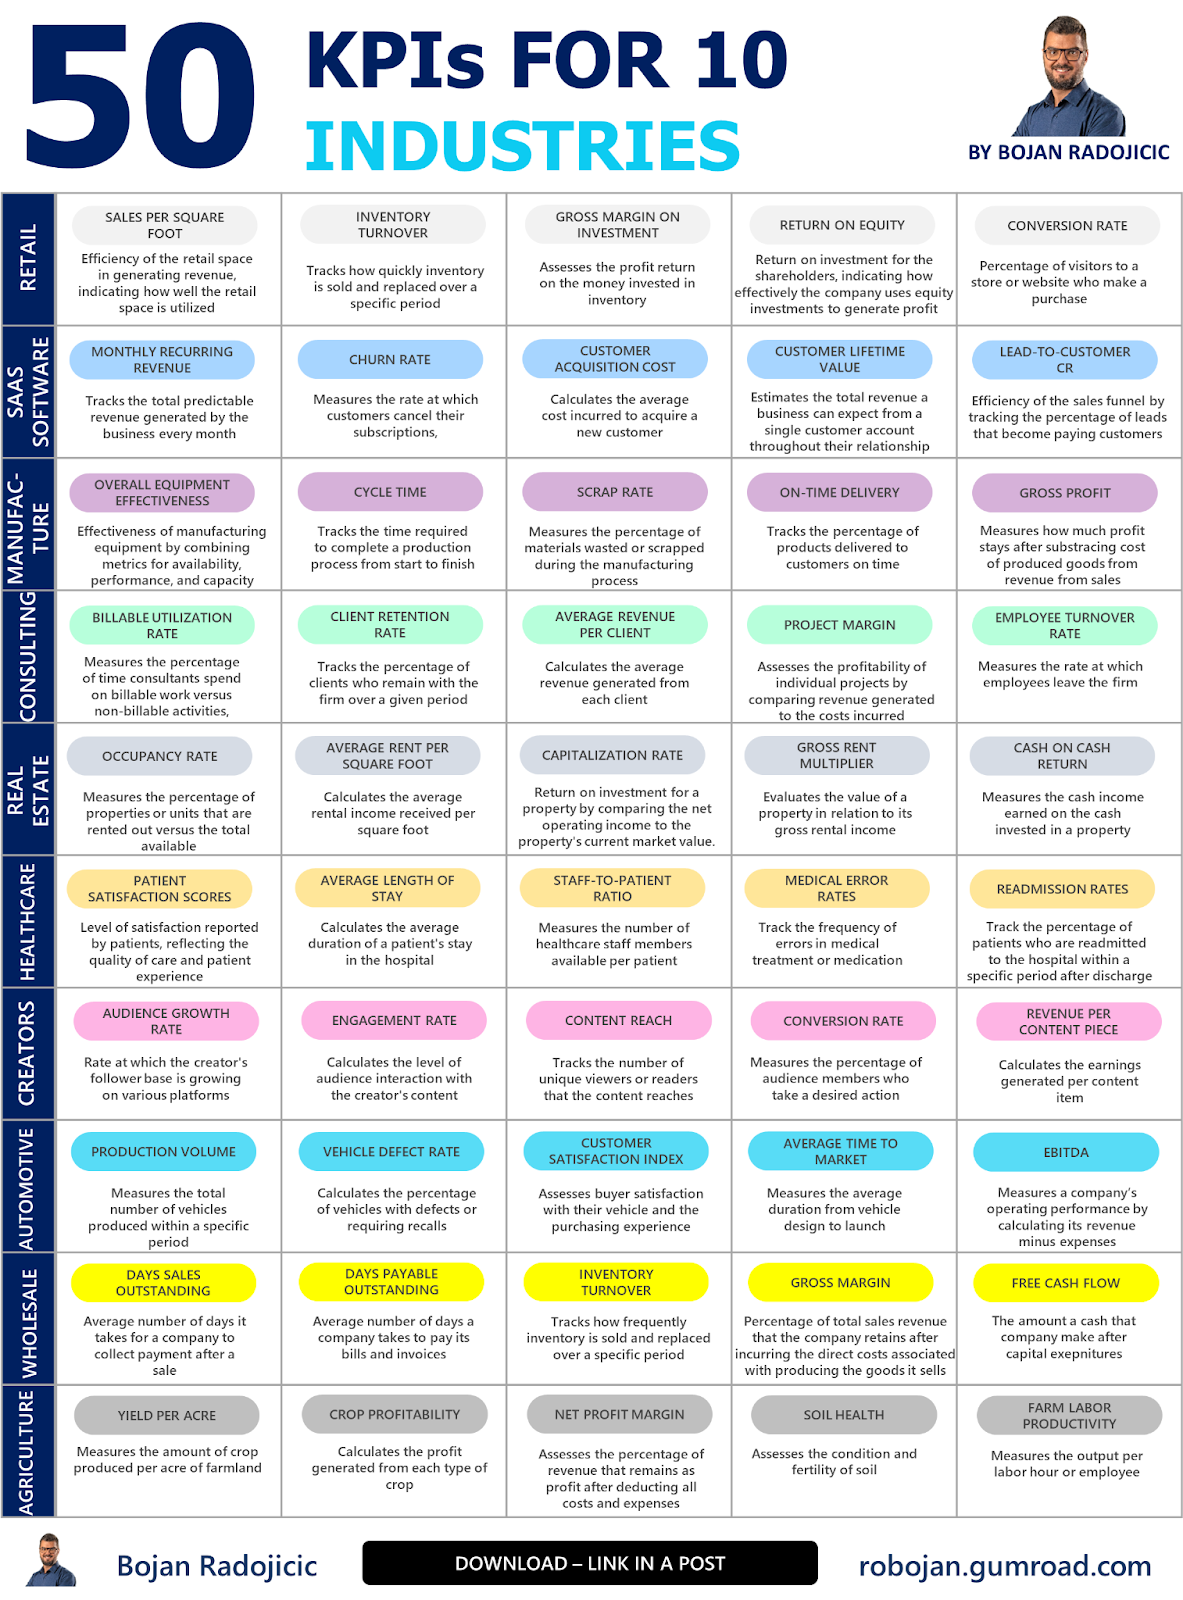
Get this infographic in a high-resolution PDF.
Here’s today’s “How to” guide:
How to set and manage financial goals
When setting goals, it’s important to know what we want, what to do to achieve it, and how to measure success.
The structure “I will _______ and by use of _________ which will be measured by ________” is a helpful framework.
For example, “I will [become a corporate finance expert] and will do this by [passing the CPA exam and working in a reputable consulting firm], and that will be measured by the level of my position and salary.”
In the financial world, we must have a thorough understanding of business processes, the thinking of management and owners, their strategy, and the company’s overall objectives to be able to comprehend and help them set financial goals.
First, financial goals should be aligned with other objectives. The Boston Consulting Group created a well-known list of balanced goals for this purpose.
Secondly, financial goals must reflect the company’s strategy. We need to understand which indicators are characteristic of a particular industry or situation.
For example, for a service company, a high gross margin is crucial because it reflects the efficiency of using direct resources to provide a certain level of services.
Another important metric is the billable rate, or the average revenue per employee, also known as the fee earner.
However, a good strategy and well-set goals are useless without implementation.
This is where the financial model becomes a powerful tool for implementing financial strategy. Once we set the goals, we lay out all the resources we have, present assumptions, and create scenarios.
All of this can be entered into the financial model to calculate the direction we are heading and whether we are on the right path. Here’s how:
- First, conduct a thorough financial analysis of existing data. Calculate the key drivers necessary for setting assumptions. These would be, for example, historical revenue growth, gross margin trends, the share of earnings in revenue, the share of capital in total financing sources, and so on.
- Then, create a scenario model where we track results against the desired scenario. For instance, see how the gross margin behaves if revenues grow by 10% vs. 15% vs. 20%. The 15% would be the base scenario, 10% the worst case, and 20% the best case.
- Once we set the drivers and scenarios, we can start planning key positions, such as revenues, expenses by all significant categories, capital investments, loans, interest, receivables, payables, and more. I suggest always planning all financial statements to have a broader picture of what we have envisioned.
When we have everything, we can calculate the KPIs that have been set as goals. When we compare this with the target KPIs, we need to determine where we stand in relation to the set goals.
It is necessary to analyze the differences and identify the causes of these discrepancies.
Then, we need to discuss with management what needs to be changed in the model to make the goals realistic and achievable.
For example, if the model shows that the level of debt is such that we do not have an adequate and desired debt-to-equity ratio, then we need to redirect resources to other forms of financing.
For instance, we could reduce net working capital to increase cash that would be used instead of additional borrowing.
This approach offer us high control about goal achievement.